Australian vs. American Foods – Which is better?
Real cohort data on ultra-processed food, not café vibes, decides which country's eating pattern actually lowers disease risk.
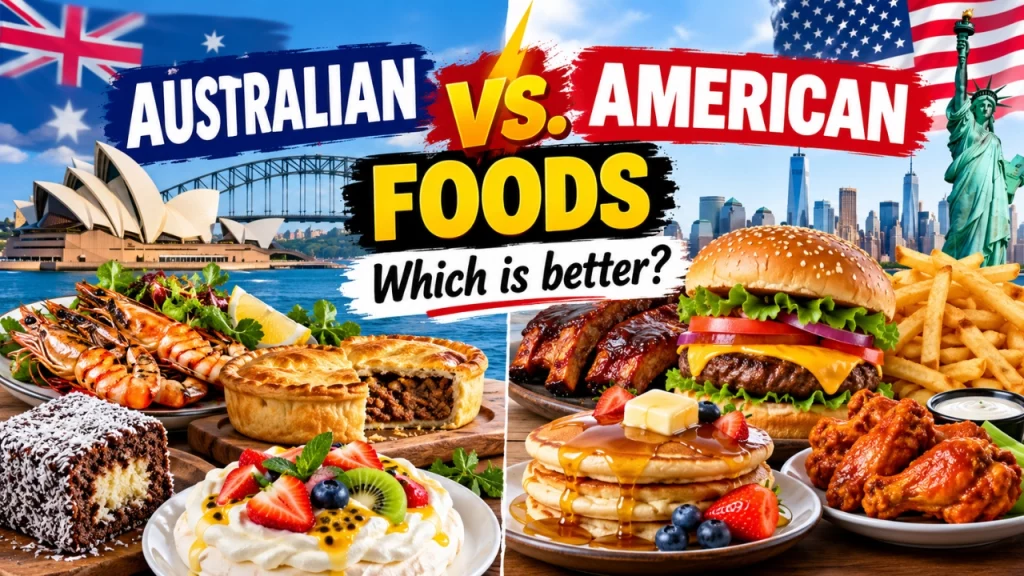
The common assumption is that this question answers itself: Australia has fresher produce, smaller portions and a café culture that shames the American diner plate, so of course Australians end up healthier. The actual cohort data complicates that story a lot. What predicts obesity, metabolic disease and even cancer risk in the research isn’t which country’s cuisine someone grew up with — it’s how much of their daily energy comes from ultra-processed food, and that number depends more on income, cooking skill and access than on a passport.
Which country’s food habits actually produce better outcomes, by the numbers?
Neither country has a single clean scoreboard in the research used here, which is itself the honest answer: the strongest available evidence doesn’t compare “Australian diet” to “American diet” as categories, it compares low versus high ultra-processed food (UPF) intake within populations, and the size of the gap is large wherever it’s measured. A dose-response meta-analysis covering 8,819,894 adults across 51 cohort studies found UPF consumption associated with a 24% higher risk of cardiovascular events, a 23% higher risk of obesity/overweight, a 24% higher risk of metabolic syndrome or diabetes, and an 18% higher risk of all-cause mortality, expressed as hazard ratios. Those numbers apply to anyone whose diet shifts toward that pattern, in any country that has one to shift toward — and both Australia and the United States do.
Does more ultra-processed food actually move body weight, not just correlate with it?
The clearest single-country numbers come from the United States, and they’re specific. A cross-sectional NHANES analysis of 4,003 US adults from 2021–2023 found each 5% increase in energy from UPFs was linked to 0.25 kg/m2 higher BMI and 0.60 cm greater waist circumference. The same study split people into three dietary patterns: “Fast Food,” “Treats and Diet Soda,” and “Lower UPF.” Compared with the Lower UPF group, the Fast Food pattern carried a 3.20 kg/m2 higher BMI and 7.76 cm larger waist circumference; the Treats and Diet Soda pattern carried a 2.83 kg/m2 higher BMI and 6.78 cm larger waist. Those are national US figures, not national Australian ones — there’s no equivalent Australian cohort in this evidence set — but they show the mechanism at a scale big enough to matter: it’s the pattern, not the nationality, driving the gap.
Is the UPF-and-cancer link solid enough to factor into the verdict?
It’s suggestive, not settled, and that distinction matters. An umbrella review of systematic reviews and meta-analyses on UPF and cancer risk found associations with overall cancer, colorectal cancer, breast cancer and gastric cancer, but the authors note results varied by age, region, dietary assessment method and study design, and the review covered only seven meta-analyses and one systematic review in total. That’s a small evidence base for something as consequential as cancer risk, and the GRADE quality assessment used in the review reflects that caution. Treat it as a reason to take UPF share seriously, not as proof that one country’s snack aisle is carcinogenic and the other’s isn’t.
Does nutrition knowledge or cooking skill explain who actually eats this way?
Yes, more than nationality does, based on the data available. A cross-sectional study of 338 adolescents in eastern Türkiye found UPFs made up 26.98% of total daily energy intake, and the quartile eating the most UPF (35.07% or more of energy) showed higher total fat, saturated fat and total sugar intake than the lowest quartile. A separate study of 293 adults in Istanbul found 57.0% were classified as high UPF consumers, and that cooking skills, food skills and dietary literacy tracked with how closely people stuck to a less processed, Mediterranean-style pattern. Neither study is Australian or American, and both are small, self-selected, cross-sectional samples that can’t prove causation — but they point to the actual lever: people with more cooking skill and food literacy eat less UPF regardless of what cuisine they were raised on. That’s the mechanism that should worry anyone comparing countries instead of individuals.
Does Australia’s “healthier food” reputation hold for all Australians, or just café-city residents?
The literacy-and-skill mechanism above is the honest answer to this gap, because no country-wide Australian UPF-access dataset appears in this evidence base. What the research does establish is that the protective effect of a “better” national food culture only reaches people who can act on it — afford it, access it, and know how to cook it. Someone far from a major grocery chain, or working multiple jobs with no time to cook, lands in the same high-UPF bracket the NHANES “Fast Food” cluster describes, whether they’re in rural Australia or a car-free stretch of American suburbia. A national average obscures that split rather than resolving it.
Does Australia’s higher grocery cost cancel out any health advantage?
It can, for anyone on a tight budget, even though none of the studies here price a shopping basket directly. The logical chain is straightforward from the evidence that does exist: if fresh, minimally processed food costs more in one country, a lower-income household’s rational response is to buy the cheaper, shelf-stable, ultra-processed option — which is exactly the “Fast Food” and “Treats and Diet Soda” patterns tied to higher BMI and waist circumference in the NHANES data. A national reputation for fresh produce doesn’t help a household that can’t afford to shop that way every week.
Do the food additives banned in one country but not the other actually change these outcomes?
Based on this evidence, probably less than people assume. None of the cohort or umbrella-review data isolates a single colorant or preservative’s effect on disease risk — every study measures the cumulative ultra-processed pattern, additives included as one ingredient among many. Regulatory lists genuinely differ between the two countries’ food safety agencies, but the dose-response findings suggest total UPF share is the stronger signal: a product can be additive-light and still count as ultra-processed by manufacturing method, and a lower-additive label doesn’t automatically mean a lower-risk pattern.
Do Vegemite, Tim Tams and Twinkies actually compare nutritionally?
Exact label figures vary by batch and aren’t part of the evidence used here, so this piece won’t fabricate gram counts for any of them — but the category answer is clear: all three are classified as ultra-processed by the same NOVA-based methodology used across the studies above. That classification is what the dose-response research links to elevated cardiovascular, metabolic and cancer risk, regardless of whether the product markets itself as an Australian biscuit or an American snack cake. The passport printed on the wrapper isn’t the variable that matters.
So which country actually wins?
Neither does, cleanly. The evidence says the real divide runs through income, food literacy and physical access to fresh food within each country, not between them — which means the “better” country depends entirely on who’s asking: a well-off, kitchen-literate city dweller in either nation lands near the low-UPF end of these studies, while a budget traveler, a rural Australian far from fresh produce, or an American without a car ends up in the same high-risk bracket no matter which flag is on the menu.
Sources
- Ultra-processed food consumption and risk of multiple chronic diseases, dose-response meta-analysis (2026)
- Ultra-Processed Food Dietary Patterns and Obesity: NHANES 2021-2023 (2026)
- Ultra-Processed Food Consumption and Nutritional Literacy among Adolescents in Eastern Türkiye (2026)
- Food Preparation Skills, Digital Diet Literacy, and Ultra-Processed Food Consumption in Istanbul (2026)
- Ultra-Processed Food Consumption and Cancer Risk: An Umbrella Review (2026)

Tom Fletcher
The latest from the Australian and global BBQ scene — comps, cooks and culture.