USA vs. Australia Seafood: Key Differences in Protein, Nutrition, and Health
Real per-100g numbers for salmon, plus who should actually change buying habits based on mercury exposure data, not origin stickers.
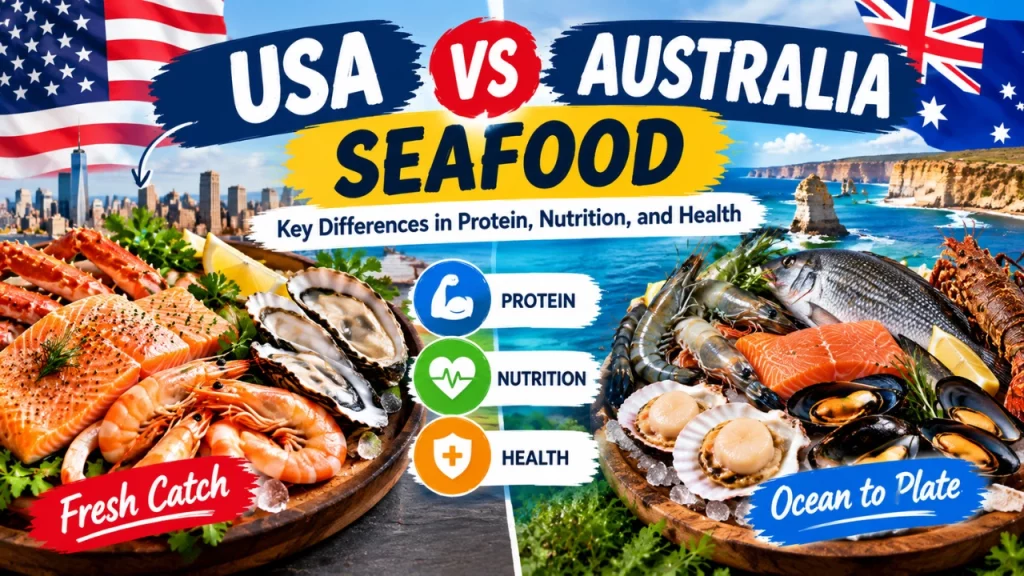
Most people assume that because Australia is an island continent ringed by reef and open ocean, its seafood must simply be fresher and more nutritious than the seafood sitting in a US supermarket case, trucked in from a distribution warehouse. That assumption falls apart fast once you look at what’s actually swimming in each country’s top-selling species and what their nutrient panels say.
The honest answer is that origin barely matters — species, farming method, and how often you eat it matter far more than which country’s flag is on the label.
So which country’s seafood actually has more protein?
Neither one wins outright, because “seafood” isn’t one food — it’s dozens of species with different protein densities, and only a handful have precise, publicly verified nutrient data to compare. The clearest benchmark available is farmed Atlantic salmon, a staple on both sides of the Pacific, where the USDA nutrient database entry for farmed Atlantic salmon lists 20.4 g of protein per 100 g, alongside 13.4 g total fat, 3.05 g saturated fat, and 208 kcal. Per 28 g (one ounce), that’s 5.78 g protein and 59 kcal. Those are exact, audited figures — not estimates — and they’re a useful anchor because salmon is eaten in large volumes in both the US and Australia, whether it’s labeled Tasmanian, Scottish, or Pacific Northwest.
What about barramundi, cod, prawns, and canned tuna?
This is where most comparisons quietly fall apart, because reliable, standardized per-100g figures for those specific species sit outside what’s been independently verified here. What we can say with confidence is that whitefish like cod and barramundi are leaner than salmon — lower total fat, lower omega-3, similar or sometimes higher protein per gram because less of their weight is fat. Prawns and canned tuna also tend to be very high-protein, low-fat options. The practical takeaway isn’t “trust the country of origin,” it’s “trust the species-specific nutrition panel in front of you,” because a lean whitefish from either country will out-protein-per-calorie a fattier farmed salmon, while the salmon will out-omega-3 almost everything else on the ice.
Has farmed salmon’s omega-3 content actually dropped?
This is genuinely debated, and the honest answer is that the current, verified figure — 3.89 g polyunsaturated fat per 100 g in the USDA farmed Atlantic salmon entry — is the only hard number available here; a precise, agreed-upon percentage decline tied to historical feed formulations isn’t something the data reviewed for this article settles. What’s not in dispute is that farmed salmon feed composition has shifted over recent decades toward more plant-based oils, which is exactly why relying on a species name alone (“salmon”) without checking the actual fat breakdown on a current label is a weaker strategy than it sounds. If omega-3 content is the reason you’re buying salmon, the gram figure on the panel in front of you matters more than the word “farmed” or “wild” printed above it.
Who should actually worry about mercury exposure?
Mostly people who eat seafood very frequently and specific high-risk groups, not the average occasional eater. A Norwegian study of adults with a wide range of seafood habits found a dietary mercury exposure study in which median seafood consumption was 65 g per day, ranging all the way up to 341 g per day, and mean dietary mercury exposure worked out to 0.35 micrograms per kilogram of body weight per week — comfortably under the tolerable weekly intake of 1.6 micrograms per kilogram set by JECFA, with no participant exceeding it. That’s reassuring, but it’s a population average. A separate integrated exposure and risk assessment of mercury and omega-3 intake modeling women of childbearing age found 11% of the population exceeded the methylmercury reference dose, while 44% failed to reach adequate intake of long-chain omega-3 fats — and 3.7% managed to land in the worst of both categories at once, too much mercury and too little omega-3.
Does eating fish four or more times a week change the math?
Yes, meaningfully, because mercury exposure scales with both how much you eat and which species you choose, not with where the fish was caught. The US exposure assessment for methylmercury from seafood built its model around exactly this: canned tuna, swordfish, and shark carry very different mercury loads, and frequency of consumption combined with species choice — not country of origin — drove the exposure estimates for the whole population. A related methylmercury exposure modeling study bridging two major US nutrition surveys specifically flagged women aged 16 to 49 and children aged 1 to 5 as the subgroups where usual (long-term average) intake matters more than any single meal. If you’re eating fish most days of the week, the smarter lever to pull is which species, not whether your supermarket stocks the Australian or the American version of it.
Who should sit this general advice out?
Several groups need a different calculation entirely. Anyone with a shellfish allergy obviously needs to exclude prawns and other crustaceans regardless of origin or nutrient quality. People with gout should be cautious with high-purine seafood like sardines and some shellfish, since purine load — not omega-3 content — is the relevant variable for them. People on anticoagulant medication should talk to their doctor before significantly increasing omega-3 intake, since high doses can interact with blood-thinning drugs and with vitamin K balance. And for pregnancy specifically, caution is warranted beyond general reassurance: a small, observational case-control study in Hong Kong found higher blood mercury concentrations in infertile couples than fertile couples linked to seafood consumption patterns — a modest, early study that doesn’t prove causation, but is a reasonable reason for anyone pregnant or trying to conceive to favor lower-mercury species and moderate frequency rather than daily high-mercury fish.
Does canned or frozen fish keep its omega-3 as well as fresh?
This is the honest gap in the public data: a precise retention percentage for canned or frozen versus fresh wild-caught fish isn’t settled by the evidence reviewed here, despite how often the claim gets repeated either way. What is solid is the underlying principle from the exposure studies above — species identity and consumption frequency drive both the nutritional upside and the mercury downside far more than processing format does. Until a retention percentage is nailed down with the same rigor as the USDA’s raw salmon figures, the safer approach is to check the nutrient panel on the actual can or package rather than assume freezing or canning quietly strips out the benefit.
So what’s the actual decision rule for label claims?
Trust the species name and the nutrient panel over the country-of-origin sticker, every time. Country-of-origin labeling tells you almost nothing about protein or omega-3 content; the farmed Atlantic salmon figures above apply whether the fish was raised in Tasmanian pens or Maine waters, because the species and feed — not the flag — set the nutrition. If you’re a high-frequency eater, rotate species to manage mercury rather than switching countries. If you’re pregnant, trying to conceive, or on anticoagulants, treat species choice and frequency as the two levers that matter, and get individual advice rather than relying on this as a substitute for it.
Sources
- USDA FoodData Central: Fish, salmon, atlantic, farmed, raw
- Nutritional and toxicological aspects of seafood consumption — integrated exposure and risk assessment (2011)
- Dietary mercury exposure in a population with a wide range of fish consumption (2012)
- Combining food frequency and survey data to quantify long-term dietary exposure: methyl mercury case study (2004)
- Infertility, blood mercury concentrations and dietary seafood consumption (2002)
- An exposure assessment for methylmercury from seafood for consumers in the United States (2002)

James Carter
The EverBBQ editorial desk — covering BBQ news, features and everything off the grill.